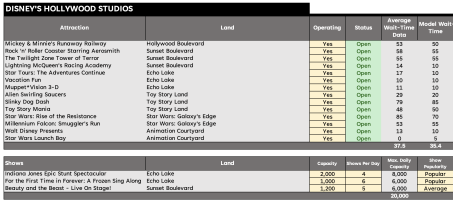
DHS model as an example (simulating an average day's attendance) of ~30K guests. Actual "average" wait-time data (from Thrill-Data) compared to my Model's wait-time.
Obviously what's posted is never 100% accurate, and my model assumes a "discount" on the THRC number to "inflate" wait times at a similar level to what the parks do.
*Model assumes that only 38% of guests are actively participating (whether in a queue or on the ride) at any time.
